“We’re expecting to distribute 8,000 trackers each day during the roadshows. The system cannot fail. How can you ensure this?”
“We had a previous experience of a lightning strike causing catastrophic system failure – what can you propose to tackle that?”
“We need to keep waiting times low and customer satisfaction high. This was the process we followed last year and these are the results. What do you propose?”
These questions marked the start of our approach to tackling one of the largest public roadshows the Singapore Government organises annually.
The National Steps Challenge™ is a national-level campaign that promotes an active lifestyle among the Singapore population. Their key baseline indicator is the participants making 10,000 steps every day, mixed with light, moderate and vigorous activities every week. The whole campaign is gamified, with various tiers of achievement giving the participants various benefits. This ranges from chances in lucky draws to redemption points, and even cruise and flight tickets.
To facilitate this, the Health Promotion Board gives out free health trackers to its eligible citizens and permanent residents based on a set of criteria. They allow participants to book appointments to collect their trackers, and even organise corporate, school, and community roadshows to distribute them. They also organise a series of 4 “Mega Roadshows” each year where they have more activities and a greater stock of inventory. It is at these roadshows that we deployed our integrated queue and inventory management system, and I’ll show you how we managed to achieve, as compared to last year –
- 50% – 80% reduction in waiting time
- 20% – 40% increase in trackers distributed
- No downtime despite some issues with a power generator
We understood that the keys to successfully deploying a queue management system for them would be innovation (in problem solving), reliability (in system uptime and functionality), and agility (in responding to unexpected situations). This is a selection of how our partner Modellscape and us approached it.
-
Identifying and analysing the expected demographics and behavior
We went in with the underlying idea that not all queue systems will work on all situations. We could tweak both the software and the processes depending on constraints like the environment, demographics and expectations there were. So, we started out by working with HPB to plot user stories based on experience and observations from the past years. This included the various types of people who would likely participate in the roadshow, their goals for doing so, and the mindset that they would have.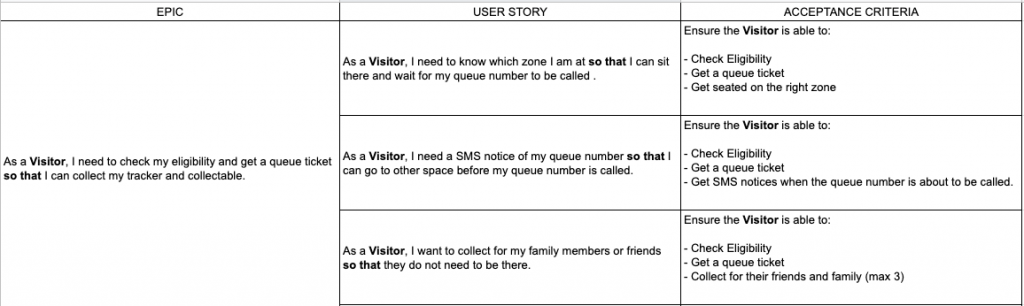
From there, we also brainstormed possible processes, problems that they might encounter, and how to resolve them.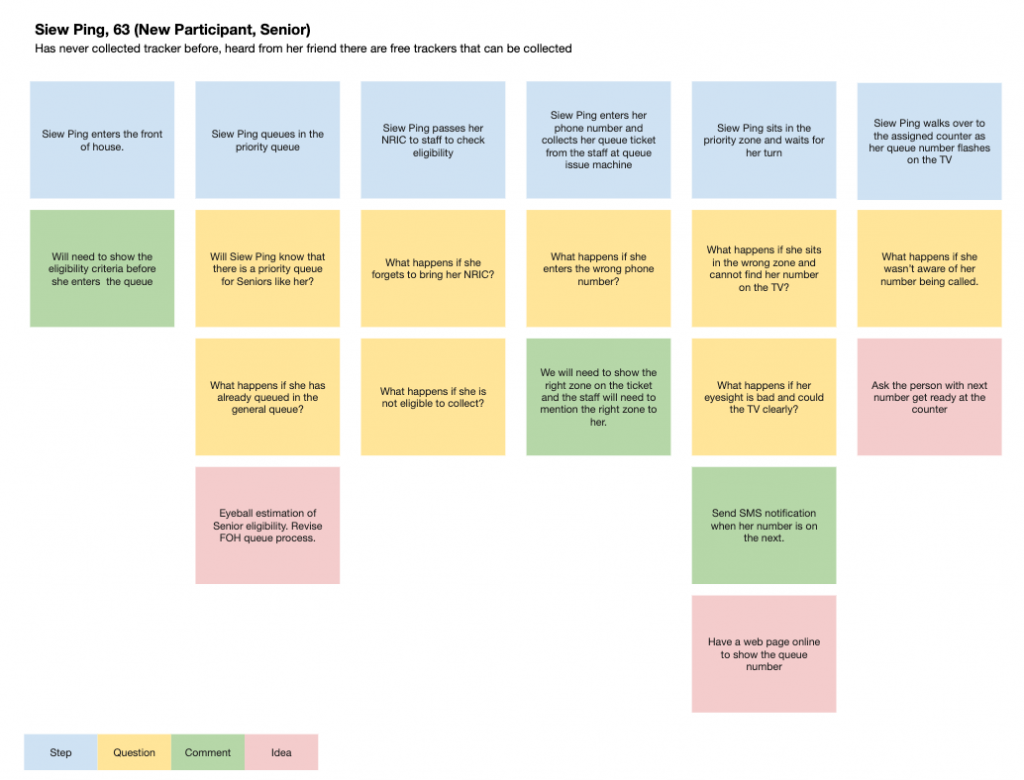
-
Optimizing the queue management process
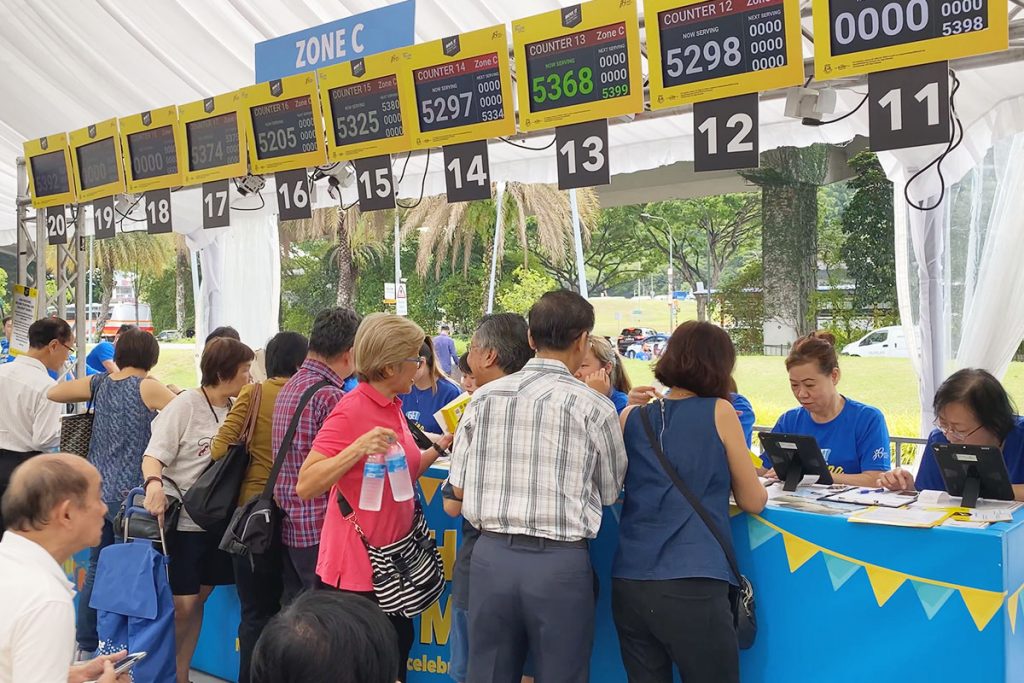
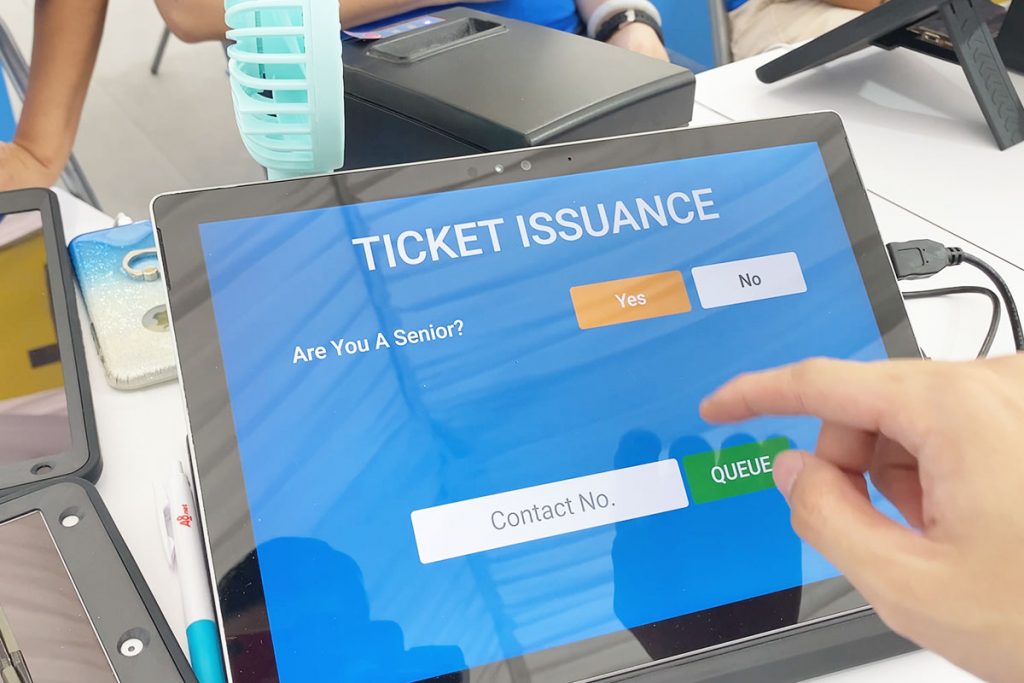
We questioned many processes in place for the previous years. For example – roadshow participants were first screened for their collection eligibility, and if they passed, they would be given a coloured token to indicate which zone they would queue at, then proceed to another counter to exchange that coloured token for a queue ticket in that zone. Realising that this caused a double-queue and was unlikely to bring much advantage, we scrapped that process and adopted a single-queue system where the screeners also issued the queue tickets. We also opted to reduce the chance of human error in the distribution and exchange of tokens by replacing that process with the answering of 3 simple questions and letting the system decide which zone the participant could queue at.
With HPB showing us past years’ queue statistics that wait times could stretch 2 hours long during peak periods, we realised it was going to be natural for some participants to leave the roadshow before coming back at a later time, and they would rather have more information than less, about how soon their turn was coming up. So we designed a screen and feature for it.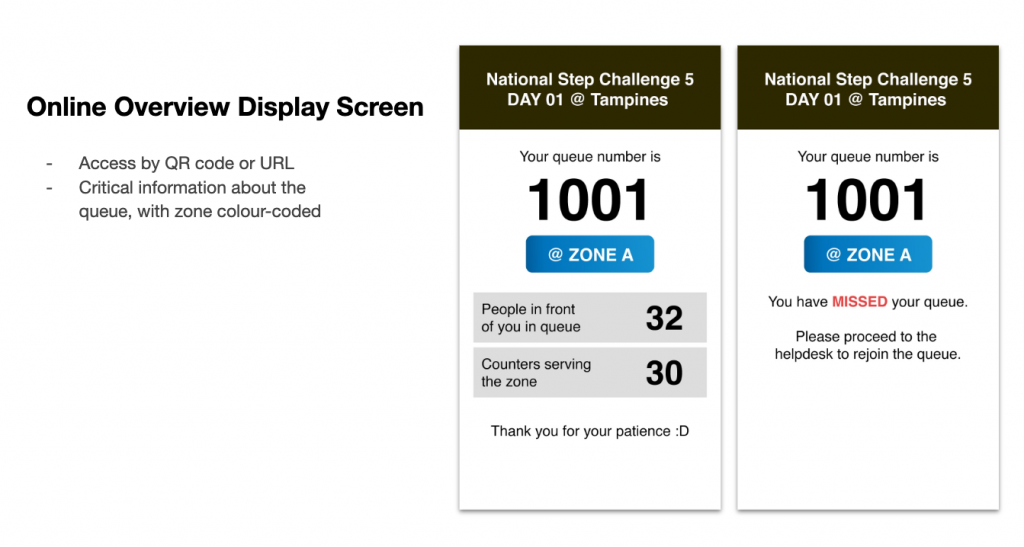
Next, I learned about this from the most unlikely place you’d think of queue efficiency – a DMV in California. Everyone thinks of the DMV as a place filled with hoards of people, long queues, and topped with slow and inefficient processes. They aren’t wrong. But there was one process that I thought was of a good concept at the DMV. We decided to propose it for the roadshow as well. The idea – pre-queues.
I’ve been at the frontline of hundreds of event registrations myself. Through these, I realised that a significant amount of time wasted on each guest’s “registration time” was actually the time it took for a guest to walk up to the counter at the start and walk away after at the end. In fact, it can even take up to 50% of the time it takes for that person to get processed. So what did the DMV do? They called upcoming queue numbers and made them stand in line behind 3 others at each counter. This effectively cut away the time it would take for any one person to move from their seat to a queue counter when their turn was called.
Extrapolating this to 80 possible counters across a long stretch of 80 meters, the massive number of people on the way, and the slower walking speed of seniors, it might even take up to 4 minutes for a participant to make their way to a counter when their number is called. How’s that for inefficiency! As such, we proposed a similar system of calling queue numbers to queue behind each individual counter, effectively reducing each counter’s transition time from serving one participant to the next.
-
Integrating a value-added system (inventory management)
From an operations standpoint, Modellscape expressed their need to be accountable for the trackers distributed at each booth to each participant. It was also integral to smooth operations that we knew when to start distributing more of specific stocks to the various counters that were running low. To that end, we quickly integrated an inventory system to record distributions that each participant with a queue number redeemed.
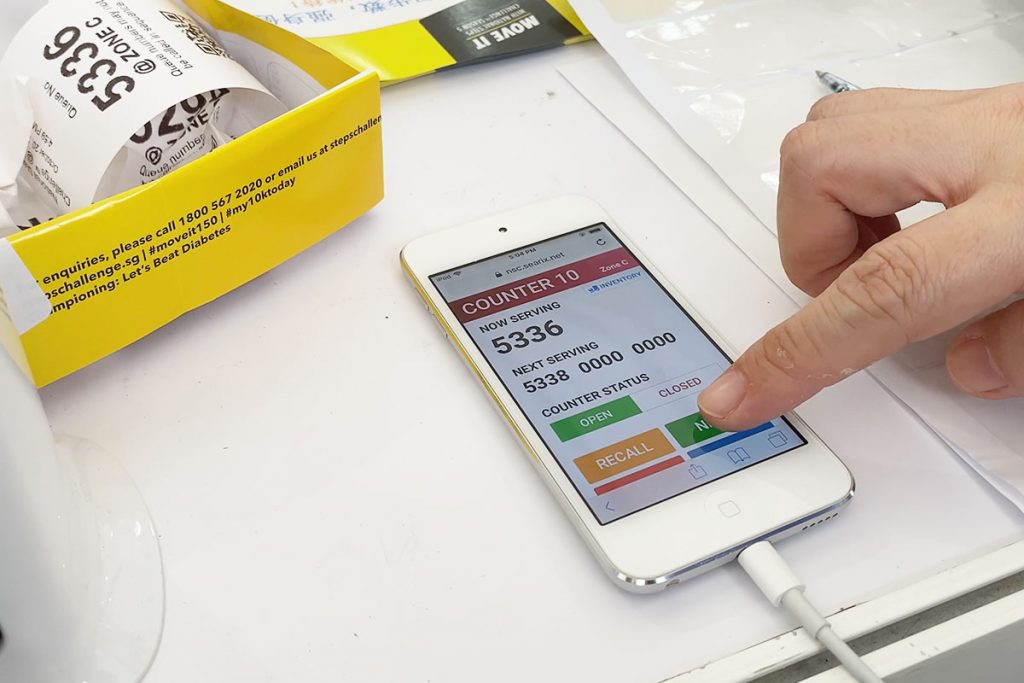
These were consolidated in a backend report so that our store operational staff were able to always tell the number of items left at each counter in real time.
-
Optimizing the queue management system infrastructure
In short, we prepared the infrastructure as if we expected the system to fail on almost every level.- We had load balancers clustered in a high-availability pair, directing traffic to 3 application servers.
- Our application servers were running nginx with PHP-FPM, benchmarked for being able to handle more than 1,000 requests per second
- Our application servers connected to a high-availability master-master database cluster, with failover databases defined
- There were 5-minute backups to an on-site server
- We worked with BlueWireless to setup 5 nodes of CradlePoints, with our own backup SIM cards and routers
- We had UPSes as backup power and surge protectors for all the equipment that did not have an in-built battery
With these and more, it was unlikely that our infrastructure would fail.
-
Creating a detailed standard operating procedure and rigorously testing
It was obvious that given the number of areas that the whole setup could fail, that we needed test runs and induced failures so that we could practice our recovery. To do that, we first created a standard operating procedure.
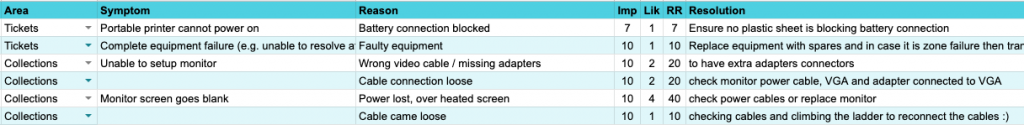
For those that had a high Risk Rating, we practiced the recovery procedures. We turned off the main database server to observe the failover, then we turned off the failover database and practiced migrating the latest database to an on-site setup. We emulated 10,000 connections on the load balancers and application servers, then intentionally turned one off and observed the response and failure rates.On-site, when we were done with the setups prior to the event dates, we would intentionally turn off the power generator to watch the UPS all kick in. This way, we made sure that all the processes could still go on in the event of power failures. Then, on the last set of roadshows in Punggol, the generator set actually had an issue of intermittent power. Our forward-thinking partners at Modellscape also anticipated for failures and had prepared for a backup generator as well. So, we switched the power source over to that, and the roadshow had no interruptions during the whole process.
-
Adapting to on-site observations and making tweaks
Finally, we believe that the most impactful key to success, was our the observation of user behavior on-site and making of on-the-fly tweaks to our operations and software.Despite expecting and planning for only a 25% senior participation rate, most roadshows brought us a 80% – 90% demographic of seniors. On the first day of the first roadshow, the queue time quickly swelled to more than 1 hour, and at its peak, we even projected for it to hit 3 hours. We were able to adapt by switching counters from serving general zones to specially serving seniors, and the average queue time for the day ended at just above 50 minutes – about the same as the previous years.
It brought about a different focus on the user journey and we realised that we would have to change the processes to include a more personal approach. We immediately added a feature that allowed our backend to show the assigned counter number of each participant. Then we quickly gave each roadshow ambassador access to our system’s backend so that they could help check on the queue status and assigned counter number of those who might need help.
Together with other tweaks and changes, we brought down average wait times on all the subsequent roadshow days to between 16 to 30 minutes, a 50% – 80% improvement from the previous years, while distributing 20% – 40% more trackers.
Looking for your own customised queue management system?